 |
| Photo by dantaylor |
Three years ago to the day I officially started blogging and I’m still here, although only just as my posting frequency has seriously diminished over time. So, once again it’s time for my blog’s annual review and an excuse for a fairly simple, straightforward post.
When I launched my blog, I optimistically planned on writing a post once a week. Over the last three years however this schedule has gradually been eroded to a pitiful average of 1.5 posts a month (18 posts in the last year). I post a monthly podcast, which accounts for 12 of last year’s posts, which means I’m now only managing to write a full post every other month, but at least I’m still here and haven’t totally given up blogging.
My main posts tend to be about 1,000 words long and up until now I’ve tried to stick to this target, preferring to write fewer, but higher quality posts, rather than hacking out more, but shorter posts. I am beginning to waver though and wonder if in between these more substantial posts I should post some random/trivial posts as they come to mind, essentially to maintain some sort of momentum on the blog? My concern is that it may devalue the overall quality of the blog…
WordPress: THE Blogging Platform
WordPress (my choice, and THE choice of blogging platform) continues to evolve, releasing regular security and enhancement updates, which I religiously keep up with install whenever they are released. I have also installed a few extra plugins to my WordPress system to enhance its functionality and improve security. I’m now using 24 plugins (a slight increase of 5 over last year’s count).
The most significant addition being a conditional CAPTCHA plugin that I added in an attempt to thwart suspected spam comments. This plugin has worked extremely well and has stopped an additional 17,173 spam comments to date!
This last year I have also updated the styling of my homepage to include a featured article box at the top of the homepage with two columns underneath, one for the most recent posts and another for the most popular posts.
Statistics for the Last Year
While my posting frequency may have dwindled, my blog has still seen a steady growth in traffic. This is undoubtedly due to my back catalogue of previous posts.
WordPress Statistics (Totals)
- Posts: 82 (64 last year)
- Visitor Comments: 315 (156 last year)
- Spam Comments: 37,506 (12,940 last year)
Spam Comments
Unfortunately, whilst my site’s traffic continues to grow, so also does the spam. In the last year the spam comments on my site have increased by 190% (the following graph shows spam comments for the last 12 months). Fortunately, most of this spam has been trapped by the Askimet and Conditional CAPTCHA plugins.
Website Analytics
I use Google’s free analytics service to monitor my website’s traffic, which provides me with a plethora of statistic regarding the site’s performance.
Each month I now receive over 9,000 visitors with over 11,000 page views. Last month’s visitor and page view statistics are:
In the past twelve months I’ve had over 98,000 visits to my site with over 128,000 page views. The following graphs show a steady rise traffic over the past year. People are also spending longer on my site (up from 1:01 to 1:24):
Traffic Sources:
The majority of my website’s traffic (82%) was brought in from search engines, with Google accounting for 79% of this search traffic! This is a slight decrease over last year, where the search engines were responsible for 87% of my blog’s traffic. As traffic has still increased overall, this is probably a good thing as it means that I’m a little less reliant on search engine traffic, particularly from Google:
Countries of Visitors:
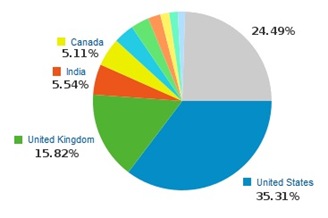
My blog attracts visitors from the world over; 178 countries/territories in total, an extra 4 countries visited this year compared to last year.
The United States and the United Kingdom remain the key countries, accounting for 51% of the traffic, with 35% of visitors coming from the US and 16% from the UK. This year India and Canada have swapped positions for third and fourth places.
RSS Subscriber Statistics
The RSS feed on my blog is provided through Google’s FeedBurner service, which also records a host of statistics about my blog’s subscribers.
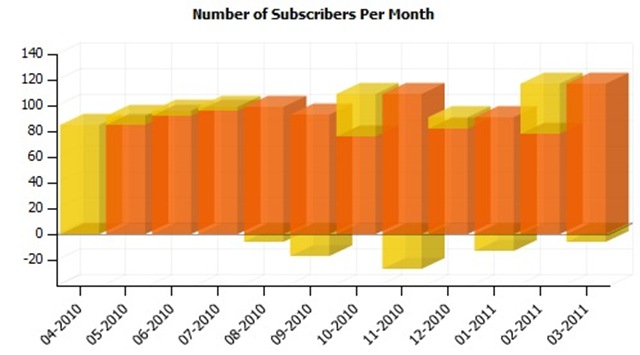
I presently have 119 subscribers (of which 21 subscribe by e-mail). This is a modest increase (32%) over last year’s total of 90 subscribers. The following graph shows the RSS subscribers per month over the last year, but also shows Feedburner’s rather erratic reporting where swathes of subscribers mysteriously disappear for a while only to suddenly reappear!
Summary
This last year I have increased my site’s visitor numbers by 117%, which I think is pretty good considering my abysmal posting frequency. You can view the two previous year’s statistics at:
The most popular post by far is still Embedding Album Art in MP3 Files, consistently receiving 65% of the blog’s entire traffic.
The top 5 posts on my blog this last year were:
- Embedding Album Art in MP3 Files (83,882 views)
- Are Your Speakers Wired Correctly? (8,813 views) up 3 places
- What is Joint Stereo? (7,872 views) down 1 place
- Song Capacity Calculator for MP3 Players (6,004 views) down 1 place
- What are ID3 Tags in MP3 Files? (4,895 views) down 1 place
And Finally…
So, a quick thank you to all of you that have subscribed to my blog and follow it regularly. Thanks very much for your continued support.
I’m still a little undecided on the way forward, whether to continue with the status quo and my present drip feed of posts, or whether to start interjecting some shorter posts when things take my fancy. Decisions, decisions…
If you’ve just stumbled across my humble blog and have managed to make it all the way to the bottom of this post, then I thank you for your precious time. While you’re here, why not check out some of my other posts, or subscribe to be updated when I get around to posting again?


Leave a Reply